Bookmark This Page
| Wednesday 5/1 Insider Buying Report: CLF, HWBK
Wed, 01 May 18:03:18 GMT |
| Wednesday's ETF with Unusual Volume: MARB
Wed, 01 May 16:39:55 GMT |
   
|
|
Get a quote box (like the one below) for your site!
|
energy quotes gold quotes
uranium stocks
solar power stocks
wind power stocks
Industry focus:
advertising stocks,
space stocks,
aerospace stock,
aerospace sector,
list of aerospace companies,
largest chemical companies,
chemical stock,
chemical news,
best agriculture stocks,
ag stocks,
chinese agriculture stocks,
top agriculture companies,
agriculture stocks,
agricultural stocks,
agricultural stock,
stocks agriculture,
agriculture markets,
agriculture index,
agriculture industries,
agricultural investment,
agriculture investment,
agricultural industry,
farm stock,
airline stock symbols,
airline stock prices,
airline stock,
airlines stock,
clothing stock,
fashion stocks,
publicly traded fashion companies,
clothing company stocks,
apparel stock,
apparel companies,
application software stocks,
asset management stocks,
auto stocks,
auto industry stocks,
chinese auto stocks,
auto stock prices,
automotive stock,
auto parts stocks,
community bank stocks,
regional bank stocks,
canadian bank stocks,
banking stock,
national bank stocks,
commercial bank stock,
banks stock,
bank stock quote,
bank stocks,
banking industry,
alcohol stocks,
beverage stock,
global wine stocks,
wine stocks,
liquor stock,
biotech stocks list,
biotechnology investing,
public biotech companies,
top biotech stocks,
nanotechnology stock,
largest biotech companies,
biotechnology stock,
biotech investing,
investing in biotech,
best biotech companies,
bio stocks,
biotech sector,
biotechnology investment,
biopharma companies,
new biotech companies,
biotech investment,
biotechnology industries,
nanotech stocks,
biotech stocks,
biotechnology articles,
biotechnology news,
business stocks,
service stocks,
chemical companies,
chemical industries,
chemical industry,
chemical company,
chemicals company,
cigarette stock,
cigarette company stocks,
cigarette stock symbols,
tobacco company stocks,
tobacco stock,
cigar stocks,
communications stocks,
communication stock,
computer peripherals companies,
computer peripherals,
computers stocks,
computer stock,
computer web,
internet stocks,
construction stocks,
machinery stocks,
builders stocks,
building stocks,
consumer goods stocks,
consumer services stocks,
consumer services companies,
lending stocks,
mortgage banking,
lending companies,
mortgage bankers,
loan services,
mortgage services,
mortgage bank,
loan bank,
defense stocks,
defensive stock,
department store stocks,
diagnostic company,
diagnostic companies,
pharmaceuticals stocks,
drug stocks,
drug company stocks,
pharma stock,
education stocks,
college stock,
electric utility stocks,
electric company stocks,
electric utilities stocks,
utility stocks,
utilities stocks,
power equipment companies,
electrical supply companies,
electronic stocks,
entertainment stock,
movie stocks,
movies companies,
movie company,
cefs,
open ended and closed ended mutual funds,
closed ended investment,
closed ended fund,
bonds fund,
closed end,
food stock,
game stock,
gambling stocks,
casino stocks,
gaming stocks list,
gaming stocks,
gas utility companies,
gas company stocks,
construction industries,
builders contractors,
construction services,
construction industry,
grocery store stocks,
supermarket stock,
drug store stocks,
home stocks,
furniture stock,
home improvement stocks,
medical company stocks,
top medical stocks,
medical stock,
hospital stock,
medical supply stocks,
medical technology stocks,
medical device stocks,
medical equipment stocks,
copper mining,
palladium mining stocks,
mining metals,
mining,
mining news,
gold exploration,
mining share price,
lithium mines,
mining industries,
international mining companies,
mining information,
molybdenum mining companies,
nickel mining companies,
metals and mining stocks,
gold and silver mining stocks,
copper mining companies,
rare earth mining companies,
rare metals stocks,
rare earth stocks,
metals stocks,
welding stock,
nonprecious metals,
non metallic mining,
office supplies companies,
office supply companies,
oil services stocks,
oil pipeline stocks,
gas pipeline stocks,
gas pipeline companies,
pipeline companies,
natural gas pipeline companies,
oil services companies,
oil field services,
oil service stocks,
natural gas pipelines,
oilfield service companies,
oil and gas pipeline companies,
oil gas pipeline,
oil exploration stocks,
oil exploration sector,
oil exploration companies,
oil drilling stocks,
oil drilling companies,
oil production companies,
china oil companies,
brazil oil companies,
china oil stocks,
brazil oil stocks,
oil companies,
oil stocks,
oil drilling,
oil exploration,
offshore oil drilling companies,
list of oil drilling companies,
oil and gas exploration,
oil and gas drilling,
oil and gas stocks,
oil and gas drilling companies,
oil refining companies,
oil marketing companies,
oil refining stocks,
oil refining sector,
oil refinery companies,
oil refinery stocks,
major oil companies,
oil sector,
oil refinery,
oil refinery company,
oil company,
oil marketing company,
oil refining company,
oil refining industry,
major oil companies list,
oil and gas companies,
crude oil stocks,
packaging companies,
container companies,
packaging stocks,
packaging sector,
container sector,
pulp stocks,
paper stocks,
timber stocks,
pulp companies,
paper companies,
timber companies,
timber trusts,
cardboard companies,
paper sector,
timber sector,
paper companies list,
silver mining companies,
gold mining companies,
gold mining sector,
precious metal stocks,
mining companies,
exploration sector,
mining sector,
exploration stocks,
mining stocks,
silver stocks,
gold stocks,
gold mining stocks,
silver mining stocks,
silver mining company,
canadian mining companies,
gold mining,
gold mining company,
mining company,
list of mining companies,
gold stocks list,
largest gold mining companies,
silver mining,
printing companies,
printing stocks,
printing sector,
newspaper stocks,
newspaper sector,
newspaper companies,
publishing stocks,
publishing sector,
publishing companies,
digital media companies,
digital media stocks,
digital media sector,
book publishing companies,
digital media company,
publishing company,
railroad stocks,
railroad sector,
railroad companies,
railroad company,
railroad investment,
major railroad companies,
real estate companies,
real estate stock,
real estate public companies,
real estate investing,
real estate investments,
real estate sector,
commercial real estate investing,
real estate investment firms,
real estate investing guide,
REITs,
real estate investment trust,
REIT sector,
REIT stocks,
REITs sector,
REITs stock,
public REITs,
real estate investment trusts,
real estate investment trust companies,
real estate investment trusts REITs,
real estate investment companies,
real estate investment company,
real estate investment trust REIT,
rubber stocks,
plastic stocks,
rubber companies,
plastic companies,
rubber sector,
plastic sector,
plastic manufacturing companies,
rubber company,
plastic company,
semiconductor stocks,
semiconductor investments,
semi stocks,
semiconductor companies,
semiconductor sector,
shipping stocks,
dry bulk stocks,
container stocks,
dry bulk shipping,
dry bulk shipping companies,
tanker stocks,
shipping companies,
shipping sector,
specialty retail,
retail stocks,
retail investing,
retail store stocks,
consumer stocks,
consumer investment,
retail companies,
retail sector,
sports stocks,
sports investing,
sporting goods stocks,
sports investments,
sporting goods companies,
sporting goods sector,
stock message boards,
television stocks,
television investment,
radio stocks,
radio invest,
media stocks,
media invest,
media investment,
media investing,
television companies,
television sector,
radio sector,
radio companies,
media companies,
media sector,
textile stocks,
apparel stocks,
textile investment,
textile companies,
textile sector,
apparel sector,
freight investment,
transportation investment,
truck investment ,
freight stocks,
transportation stocks,
trucking stocks,
trucking companies,
trucking sector,
waste management stocks,
waste stocks,
recycling stocks,
waste investment,
waste companies,
waste sector,
water stocks,
water utilities,
water investing,
water investment,
water companies,
water sector
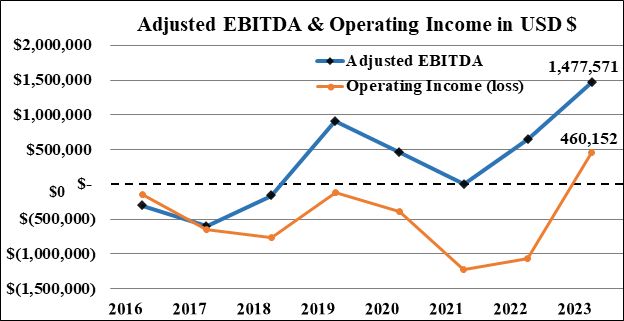
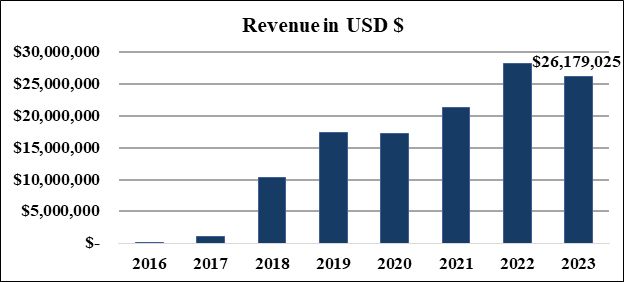
Nova Leap Health Corp. Posts Record Fourth Quarter and 2023 Annual Financial ResultsNOT FOR DISSEMINATION IN THE UNITED STATES OR FOR DISTRIBUTION TO U.S. NEWSWIRE SERVICES HALIFAX, Nova Scotia, March 07, 2024 (GLOBE NEWSWIRE) -- NOVA LEAP HEALTH CORP. (TSXV: NLH) ("Nova Leap" or "the Company"), a growing home health care organization, is pleased to announce the release of financial results for the year ended December 31, 2023. All amounts are in United States dollars unless otherwise specified. Nova Leap Q4 2023 and Year End Financial Results Financial results for the three and twelve months ended December 31, 2023 include the following:
This news release should be read in conjunction with the annual Audited Consolidated Financial Statements for the year ended December 31, 2023 and 2022 including the notes to the financial statements and Management's Discussion and Analysis dated March 7, 2024, which have been filed on SEDAR. About Nova Leap Nova Leap is an acquisitive home health care services company operating in one of the fastest-growing industries in the U.S. & Canada. The Company performs a vital role within the continuum of care with an individual and family centered focus, particularly those requiring dementia care. Nova Leap achieved the #42 ranking on the 2021 Report on Business ranking of Canada's Top Growing Companies, the #2 ranking on the 2020 Report on Business ranking of Canada's Top Growing Companies and the #10 Ranking in the 2019 TSX Venture 50™ in the Clean Technology & Life Sciences sector. The Company is geographically diversified with operations in 10 different U.S. states within the New England, Southeastern, South Central and Midwest regions as well as in Nova Scotia, Canada. NON-IFRS AND OTHER MEASURES: This release contains references to certain measures that do not have a standardized meaning under IFRS as prescribed by the International Accounting Standards Board ("IASB") and are therefore unlikely to be comparable to similar measures presented by other companies. Rather, these measures are provided as additional information to complement IFRS measures by providing a further understanding of operations from management's perspective. Accordingly, non-IFRS financial measures should not be considered in isolation or as a substitute for analysis of financial information reported under IFRS. The Company presents non-IFRS financial measures, specifically Adjusted EBITDA (as such term is hereinafter defined), as well as supplementary financial measures such as annualized revenue and annualized adjusted EBITDA. The Company believes these non-IFRS financial measures are frequently used by lenders, securities analysts, investors and other interested parties as a measure of financial performance, and it is therefore helpful to provide supplemental measures of operating performance and thus highlight trends that may not otherwise be apparent when relying solely on IFRS financial measures. Adjusted Earnings before interest, taxes, amortization and depreciation ("Adjusted EBITDA"), is calculated as income from operating activities plus amortization and depreciation and stock-based compensation expense. The most directly comparable IFRS measure is income from operating activities. Annualized revenue is calculated as actual revenue for a specific period of time extrapolated over 365 days. Annualized Adjusted EBITDA is calculated as actual Adjusted EBITDA for a specific period of time extrapolated over 365 days. The reconciliation of Adjusted EBITDA to the income from operating activities is as follows:
FORWARD LOOKING INFORMATION: Certain information in this press release may contain forward-looking statements, such as statements regarding future expansions and cost savings and plans regarding future acquisitions and business growth, including anticipated annualized revenue or annualized recurring revenue run rate growth and anticipated consolidated Adjusted EBITDA margins. This information is based on current expectations and assumptions, including assumptions described elsewhere in this release and those concerning general economic and market conditions, availability of working capital necessary for conducting Nova Leap's operations, availability of desirable acquisition targets and financing to fund such acquisitions, and Nova Leap's ability to integrate its acquired businesses and maintain previously achieved service hour and revenue levels, that are subject to significant risks and uncertainties that are difficult to predict. Actual results might differ materially from results suggested in any forward-looking statements. Risks that could cause results to differ from those stated in the forward-looking statements in this release include the impact of the COVID-19 pandemic or any recurrence, including staff and supply shortages, regulatory changes affecting the home care industry or government programs utilized by the Company, other unexpected increases in operating costs and competition from other service providers. All forward-looking statements, including any financial outlook or future-oriented financial information, contained in this press release are made as of the date of this release and included for the purpose of providing information about management's current expectations and plans relating to the future, and these statements may not be appropriate for other purposes. The Company assumes no obligation to update the forward-looking statements, or to update the reasons why actual results could differ from those reflected in the forward-looking statements unless and until required by securities laws applicable to the Company. Additional information identifying risks and uncertainties is contained in the Company's filings with the Canadian securities regulators, which filings are available at www.sedar.com. CAUTIONARY STATEMENT: A photo accompanying this announcement is available at https://www.globenewswire.com/NewsRoom/AttachmentNg/07ed9d31-cbf4-4520-881e-7d57891415f0 A photo accompanying this announcement is available at https://www.globenewswire.com/NewsRoom/AttachmentNg/4a708783-361b-4874-a375-7be09a9fac7a 
| ||||||||||||||||||||||||||||||||||||||||||||||||||||||||||||||||||||||||||||||||||||||||||||||||||||||||||||||||||||||||||||||